
We’ve all heard a lot about the importance and value of data in the 21st century. But many credit unions don’t know where to start, or how to go about creating business value out of their data. In this blog series (at least 5 blogs), I’d like to pose a process for getting started.
The framework/context
It’s useful to think about the topic in terms of the analytics curve that I’ve referred to several times in a number of contexts. On this curve, the x-axis is generally labeled as the “sophistication of insights”, but I’d prefer to think about it in terms of “the types of things accomplished by the data strategy.” The y-axis is labeled “competitive advantage” but really could be a few other things, such as “business value” or “quality of decisions”.
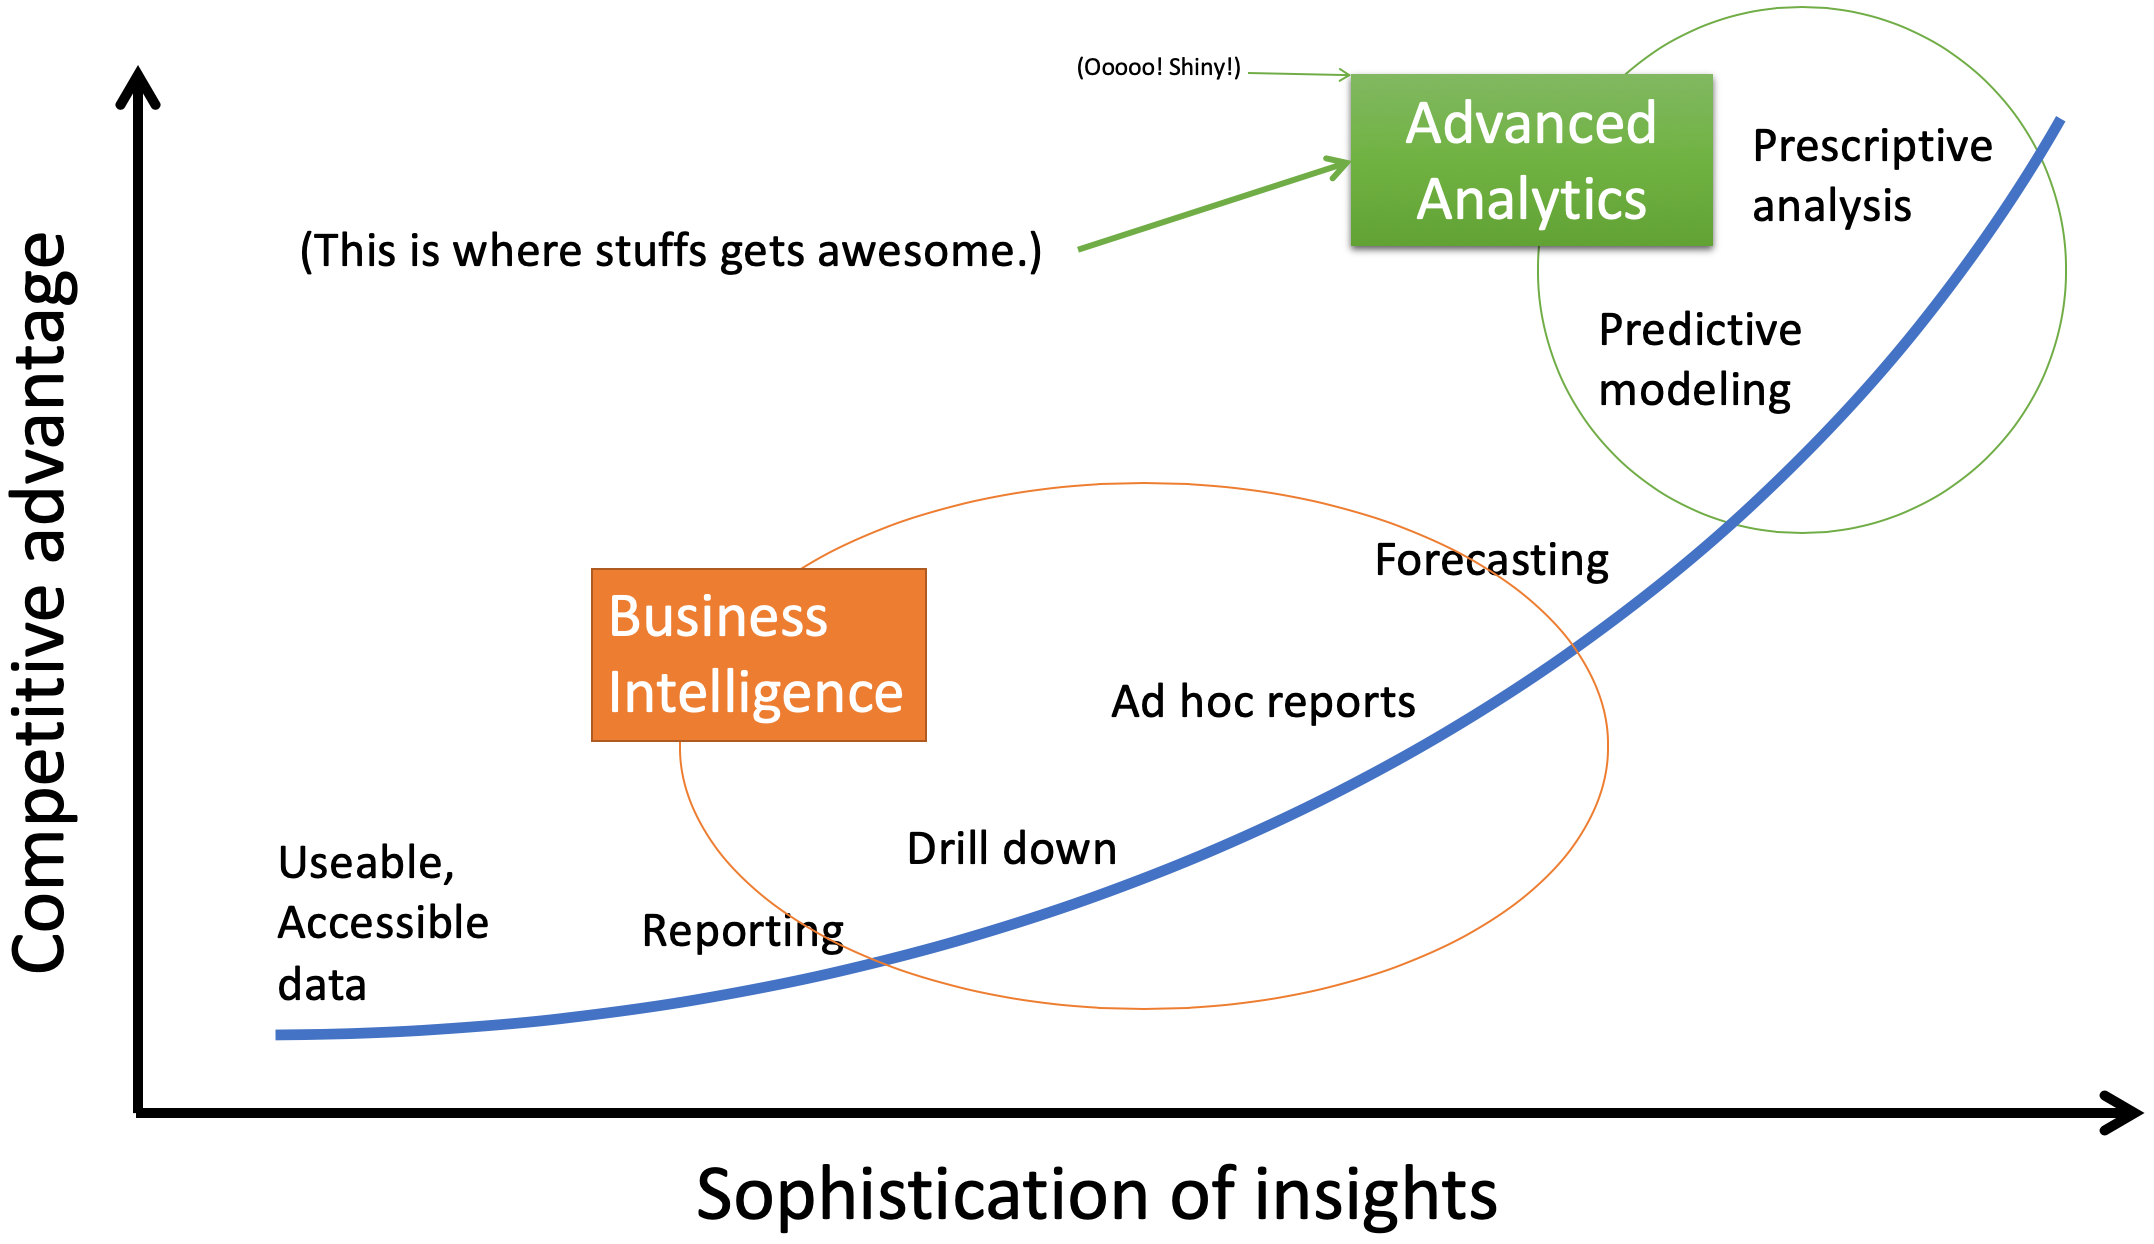
The idea of the chart should be familiar: the better you use your data, the better your decisions become (and the more valuable your data becomes). After all, good decisions come from good information, and data analytics is all about improving information quality. The value you gain from your data is a function of what you can do and actually do with that data.
In general terms, what can a credit union do with its data? That’s what’s on the x-axis. It starts pretty simply, with just having data that you can use and access. After all, if you want to analyze data, you have to be able to get to it and put it into a useable format. Whatever data you can get to, you can then start to generate reports on. You can drill down into that data through dynamic or ad hoc reports, to find patterns, groupings, summaries, averages, anomalies, etc. that you previously hadn’t ever seen. Then you can build tools to help you forecast data based on past data and variables you establish.
Those are pretty standard things, these days. If you’re not there, you’d be surprised at the insights you can get with those steps. But a lot of the power comes in the last two steps, that fall under “advanced analytics.”
Basically, computers are really good at crunching a lot of numbers. There are many ways they can look at millions of pieces of information and find patterns that humans could never find. These patterns can predict future behavior, performance, preferences, and any other number of things. Once the future is predicted (predictive modeling), the computer can also make recommendations on what to do (prescriptive analysis).
These days, “advanced analytics” is what appears to be magic to many people. But it’s just fancy math performed by a computer crunching bucket-loads of data.
So, it’s within that framework that I’d like to discuss actually using your data and getting the value.
Useable, accessible data
The lower left corner of the curve specifies that first, we must have “useable, accessible data”. There’s a pretty wide spectrum of what this means. Here are a few examples, starting with the simplest and least powerful, and moving toward more complicated and more powerful:
Remember that in order to gain any of the insights enabled by steps further to the right on the x-axis, you need to have the appropriate level of useable, accessible data. This really is step one. No joke.
How sophisticated you get in this part of the curve will determine what you can do later. That said, it doesn’t mean you have to immediately get to a data lake. You may be able to get by with an easier, less expensive solution, depending on the amount of data you have, and what you want to do with it.
Reporting, drill down, and ad hoc reporting
The next three items on the x-axis are all related to each other. They’re all about taking the useable, accessible data, and generating useful insights through reports.
The first one, plain old reporting, is exactly what it sounds like. Static summaries of information, presented on paper or on a screen. This is likely what you’re used to from many of the systems you have. Summaries. Averages. Year-to-date or month-to-date totals. Etc.
The second one, drill down, makes these reports interactive. Therefore, they must exist on a computer. Users can click on pre-built reports to get more details about a particular item. For example, they click on the “new loans” item, and can see a breakdown of new loans in the last month or last year. They click on the write-offs total and are presented with a pie chart of how those charge-offs break down. Really, you could probably get much of the same with multiple static reports. Drill down just makes a lot of those static reports more accessible and findable.
In this step you could also perform more sophisticated analysis with these reports: identifying anomalies, finding patterns, considering data graphically, etc.
Ad hoc reporting puts the power of creating reports into the hands of the users. So, rather than just having to accept the reports created by someone else, or having to request someone else to make a new report, end users are able to build their own reports with ease. When they have questions not answered by current reports, they can click and drag data fields into charts to get that data on demand, when they want it.
Of course, the more developed and accessible your data is, the better any of these three types of reports can be. For example, if you only have data from one source, you can only summarize that data in a vacuum, whether it be through static reports, drill down, or ad hoc. But if you’ve managed to tie multiple data sources together, your static reports can give you insights you would have otherwise had to piece together manually—if you could at all.
Forecasting
Forecasting has been going on . . . well, probably since people started wondering if they would have food later in the day. In today’s world of bits and bytes, there are a lot of ways to forecast, each more complicated than the next.
All forecasting involves some kind of learning from past experience, and projecting those lessons into the future. On a most basic level, this looks like, “Recently, this is what has happened, so we will assume that is what will happen in the near future.”
You can complicate the idea by adding other factors, such as the history of the environment and how performance was in those different environments, coupled with a prediction of the future environment and how that will affect future performance. You can add other parameters, such as changes to your practices or strategies. You can look further back in time, or try to peer further into the future.
Without getting too technical, you can also use different mathematical formulas or functions to forecast, each weighing various factors differently, or accounting for this or that past variance by doing this or that to the math. It can get pretty complicated, and it’s a good thing to have computers along to help in the process.
Forecasting is generally performed at a general level, for example, across an entire segment of loans, all deposits, or an entire branch. It’s focused on the future outputs, and summaries of those outputs.
Predictive modeling and prescriptive analysis
I added the last paragraph above because I realized that forecasting is a type of predictive modeling, and I had to ask myself, “What’s the difference between predictive modeling and forecasting?” The answer is that the output of forecasting is to predict general, summary information. Predictive modeling is to forecast what will happen in the individual instance.
For example, if we want to forecast our loan balances, we will look at summary information of all our loans together. It will tell us nothing about what individuals are likely to take out loans. That’s the job of predictive modeling—what individuals will do.
This is where things get exciting. Almost magical.
How does it work? In essence, computers do some very fancy math to predict the future actions of individual people or things. Will this person or that person take out a loan? Will this loan or that loan go bad? Will this transaction turn out to be fraudulent or not?
Let’s take the fraudulent transaction as an example. If you want to predict if a new transaction will turn out to be fraudulent, you will have to build a way to predict it. So, you take attributes about past transactions, some of which have been fraudulent and some of which have not been. The computer looks at the data in many ways, and builds a picture of what a fraudulent transaction looks like. This picture is called the “model”.
Then, to predict whether or not a new transaction will be fraudulent, the computer compares the attributes of that new transaction with the model for fraudulent transactions, and makes a judgment. Does this transaction look like past fraudulent transactions? It may give a definitive yes or no answer. It may give a likelihood. It all depends on how the model is built.
You can imagine how useful it might be to know the future of individual things—this allows you to interact with them more effectively.
How effective and efficient your predictive modeling is will depend somewhat on that first step—how useable and accessible your data is.
At the simple end of the spectrum you can build predictive models in a one-off manner, exporting data from systems, building models, feeding new data to the models, and having an output that you use once. An example of this might be to create a mailing campaign. You analyze the data, and predict that these certain members are more likely to take out a car loan. So you mail them a postcard advertising your car loan rates. This is a slower, more manual process. The model is built and may be used in the future, but also may not be used again. New data is passed through it in a batch process, maybe just once.
At the more complicated end of this spectrum, the predictions may be made in real time, not in a batch. Then, the results of that prediction (whether someone did what was predicted or not), can be fed back into the system to help it improve its decision-making abilities.
For example, let’s say you want to show an advertisement to each member that logs into your home banking platform—but you don’t want to show everyone the same thing. You want to show them something that is most relevant to them. So, you create three advertisements, one each for auto loans, your VISA rewards card, and a home equity loan. How do you know what to show them? Which ad are they most likely to click on?
Well, you use your data to try and predict how likely someone is to purchase each of the three different products. It won’t be perfect—there will be error in the model—but it will be better than a random guess. Then, when a member logs in, your system looks at which of the three products was predicted to be the best one, then shows the correct advertisement. Over time, as you gain new data about what people click on, the model adapts automatically, in essence becoming smarter and offering up better advertisements.
The first example was a batch process, ran once. There’s definite value in it. The second example shows how a predictive model can be deployed over time, in real-time, on an individual basis, providing even more value.
In fact, that second example also passes into the realm of prescriptive analysis. Basically, after the prediction was made, the computer recommended an action: show such and such an ad. It prescribed what was to be done. And that is the point furthest to the right on the x-axis. After the machine predicts the future, it makes a recommendation on what to do about it. The less sophisticated solutions will simply make the recommendation to a person, who then can decide whether or not to do anything with it. The more sophisticated solutions will go ahead and just take the action. Then, hopefully, there will be a feedback loop that teaches the machine whether or not it took the right action. Then it can learn from that result, and make better decisions in the future.
Tools
So, now that you have a better idea for what can be done with data, let’s talk very briefly about tools. And by tools I mostly mean software. There’s certainly some hardware here, but I think in the end the computer equipment ends up being relatively easy. Software is where the options become mind-boggling.
There’s an incredibly wide range of tools out there, filling the entire broad spectrum in features. There are, of course, vendors and tools that will do it all for you. They’ll create a data warehouse that pulls in and organizes all your data, gives you reporting capabilities, and then facilitates building and using predictive and prescriptive models.
There are also tools out there just for creating a data warehouse, just for reporting, and just for predictive analytics. Some tools perform several functions. They may make your data useable and accessible, and then provide reporting on it—all without creating a new database. They just pull data dynamically (maybe even from multiple sources), and then allow you to create all manner of reports.
All vendors have particular tools that they like. Those tools may be developed in-house by the vendors. Or, the vendors may use an open-source (or maybe not open source) product widely available to everyone, and it turns out they’re just really good at deploying it.
You may not need a vendor. You may be able to select tools yourself, and implement them at your institution. A lot of tools are designed to be intuitive, and someone with a little technical knowledge can learn how to implement them.
Which brings us to the next blog topic: where to start. That’s really what we’ve been driving at. Until now I’ve just been building a common foundation of knowledge and language so that we can intelligently discuss this topics of “Where to start?” and “How to go about doing this?”
I don’t want to talk about data strategy here, because I think that topic has been covered by many others very well. In the end, the broad “data strategy” should be something along the lines of “use our data to improve our decision making.” That’s the data strategy. What we really want to talk about is the strategy for developing a system that allows us to use our data to improve our decision making.
Many times when talking about a strategy, people want to immediately get to tactics. But first you have to come up with a strategy. It’s a higher-level plane of thought than tactics, and coming up with a strategy leads to tactics. If you skip strategy and go straight to tactics, you can end up spinning your wheels and going nowhere.
A strategy is a plan of action designed to achieve an overall aim. If we stay general here, and say the overall aim is to “improve decisions”, we need to ask, “what is the plan of action to improve our decisions?”
There are a couple of broad strategies that I’d like to discuss:
(Remember, the x-axis is from the chart I introduced in the first blog in this series.)
Naturally, each of these strategies has positives and negatives. You can also mix and match these strategies in endless ways. In fact, while I outline three strategies, there are many, many ways to go about this. Think of it as a spectrum, and I am outlining three points along the spectrum. You could choose a point anywhere along the line, and potentially have a good way to tackle the problem.
Go all-in from the start
This ambitious strategy will take you from nothing to everything—all in one shot. In this strategy, you fully develop capabilities at all points along the x-axis at the same time, building them to integrate fully with one another from the get-go.
There are two ways to do this:
You can imagine what the advantages and disadvantages of each might be.
Hiring a vendor has the advantage of the backbone already being set up. The vendor has its systems and people in place; it’s a matter of hooking your data up to it, and turning it on. That’s much more difficult than that one sentence makes it sound. There’s still plenty of work to be done, but less work than if you do it in house. You will certainly need people who can respond to their technical and non-technical requests, and manage the project.
Doing it in-house probably means selecting solutions for every point along that x-axis, and then integrating them with each other. Or one solution that does it all for you. If you don’t have the knowledge and expertise at your credit union, you’ll have to acquire it by training your current staff or hiring other people.
Either case—in-house or using a vendor—will require extensive financial resources. We’re talking a major project that will take some time. That’s the first drawback to the “go all-in upfront” approach. The upfront cost is high.
There are a few other potential drawbacks to this approach, the first being that it’s unclear when you will start gaining value. If you invest all of this time and money and effort into a system, but it doesn’t really work until everything is in place . . . it may be some time before you start seeing value. Now, you likely will get different pieces up and running along the way. Useable reports here and there. Some predictive models built here and there. But if you’re trying to do it all at once, the bulk of the value will come at the end, once everything is up and ready. Every stumbling block along the way means the benefits are further out. Every delay means you’re that much further out from realizing your value.
The other drawback is that if your credit union doesn’t already have a culture of using data, when the system is built you might all stand back and admire it, and then look at each other and wonder, “What are we going to do with this?”
I exaggerate, of course. And if you choose a good vendor, they will help with this. But the main problem remains—if the culture of your credit union isn’t already used to using the data, you may have built this very sophisticated system, and not fully utilize it. I guarantee that at some future point after building the system, someone will say, “I wish we could do XYZ.” And someone who was intimately involved in the project will look at them with exasperation say, “We have been able to do that since we finished the project!”
Culture is always the biggest challenge with any change. It will be the same with a data strategy. If people don’t see the value of the project, don’t understand how to use it, or fear what it may mean for them and their jobs, it doesn’t matter how much time and money you spend. One way or another, they will stop it.
So, delay in benefit and a culture that isn’t ready—those are the main drawbacks. Aside from the cost (a small thing). The benefits are that when everything is running as it should (including the people using the system), you will get tremendous business value.
Advance linearly along the x-axis
This method entails moving one step at a time along the x-axis, making sure you’ve got everything working properly and thoroughly before advancing. There’s a pretty good case to be made, here, although the time to realize value is one of the roadblocks.
In this strategy, we would first make sure we have as useable and accessible data as possible. We wouldn’t be satisfied with pulling data from different places on an as-needed basis to build reports. Rather, we would build that data warehouse and ensure it’s up and running before trying to get into any reporting.
Once we have a solid data warehouse in place, then we will start with our reporting functionality. We make the reports we currently use readily available, and maybe even automate their creation. From there, we start to build reports that allow us to drill down and get more details, and once we are very satisfied with our effort there, we incorporate the ability for end-users to build their own ad hoc reports.
You get the idea, I think. We master each step before moving on to the next. Eventually, we will reach the pinnacle of prescriptive analytics. We might even have a roadmap in place at the outset, indicating milestones of achievement, deadlines, vendors or solutions to use, etc. It’s a very measured approach.
The advantage here is that we can eat the elephant one bite at a time, and become very comfortable with each step along the path before moving on to the next. This allows us to try and change our culture one step at a time.
The primary disadvantage here is that the first step—that data warehouse—is a pretty big step. It’s pretty expensive, and will likely be time consuming. It may take a while to get everything in place. In the meantime, we’re sinking resources into something that we aren’t seeing much benefit from. Once we finally get those static reports generating, people will see that it’s the same information they’ve always had access to, and might become disillusioned with the project. “That’s it?” they say. “All that time and effort and we have the same stuff we already had?” Only once you move into the drill down and ad hoc reporting do people finally start to see some benefit. The really good stuff—the advanced analytics—are still a ways off.
Of course, as with the previous strategy, there are myriad vendors that can help you along the way. I rather suspect that any vendor who provides a data warehouse strategy will try to provide reporting and advanced analytics capabilities. In fact, they will likely say that there’s not much point in just building a data warehouse—you need to start using it right away. And they are right. You want to move as quickly as you can from having accessible data to using that data. The data warehouse isn’t the end goal—doing something with it is. Move as far right as possible as quickly as possible, to gain maximum value.
In fact, that first step—the data warehouse—is such a huge hurdle that reporting may even afterthought, a quick stepping stone to advanced analytics. But don’t skip it. There’s a lot of value to be had from good reporting. Just be aware that it may almost just come bolted on top of the data warehouse solution.
I would categorize this as the slow and steady wins the race method.
Advance incrementally at all points along the x-axis
In this third methodology, we work on all points along the x-axis at once. The main goal with this method is to start seeing results and gaining business value as quickly as possible, while at the same time establishing a culture of analysis and data consumption.
Rather than try to get the perfect data warehouse out of the gate, we will pull data from multiple sources, perhaps even in batches, on an as-needed basis. Or, we may have a go-between solution, that bridges the many data sources but doesn’t duplicate or actually store data.
We may build drill-down reports on an as-needed basis, as requested by end users. Or, we may batch process a predictive model for a one-time use for marketing.
This is an “identify the low-hanging fruit, and go for it” approach.
The starting costs will be lower, and the required expertise will probably be something you can handle. As you tackle one small project at a time, gaining experience and value along the way, your staff will be able to handle increasingly difficult tasks, and at the same time start to see the benefit of the project and get on board with increasingly taxing efforts.
The point is that we’re not going to wait to start gaining business value until we have the perfect set up. We also want end users to start seeing how the analysis can improve their decision-making right out of the gate. If they see the value, they will request more features, and they will be the ones driving the development, always anxious for the next step so they can do their jobs better or more efficiently.
The idea is that you build it as needed, and develop your systems and capabilities a little at a time, only when you have a visible way to actually gain value.
Ultimately, this could be a more expensive and slower way to develop a system, although that expense will likely be spread out over more reporting periods. It is certainly slower, because you’re building it one piece at a time. Also, you may build something and then at the next step decide you want to build it differently—or use a different system. So, you start over or take a step or two back. That may also add more expense and time.
But it’s also good, because it ensures that you’re building something that people are going to use. You start realizing value pretty quickly, and when people see value they start to imagine how else this might help them. They develop ideas for what to do next. The culture changes, and drives the development of the system.
This is likely a slower approach. Maybe also more expensive in the long run (maybe). It would be important to manage your expectations and recognize this as an iterative process. It’s likely that we won’t get it 100% right on the first try. It may be two steps forward, one backward. You may spend money on going down a certain road, then get there and realize you took the wrong road. That doesn’t mean the project is a failure. You’ve gained valuable experience. Learn from it and use what you’ve learned. But along the way you should see little victories, and as your confidence increases in the little things, you can become more ambitious in what you want to accomplish.
So, those are some possible strategies for developing your system to improve your decisions (that’s a mouthful). But which strategy is right? I still haven’t answered the question of “Where to start?”
Finally, we’re here–after three parts of building the groundwork, we’re to the point where we will start to develop the program. How, exactly, do you start to go about using your data to make better decision? How you decide what strategy to use to develop the system that allows you to use your data to make better decisions? Well, just start talking.
Brainstorm and talk
Talk about the strategies with your team. Explore the possibilities and advantages and disadvantages with each. Over the course of a discussion or two, I suspect a preferred strategy would emerge.
In these discussions, explore what you want to accomplish. Until now I’ve spoken in terms of “make better decisions”, but in this case it doesn’t count. It’s too broad. Specifically identify what kind of decisions need to improve. Lending. Marketing. Collections. Fraud detection.
Another idea is to create a set of use-case scenarios that explain exactly what you hope to accomplish. A use-case is a very useful tool in which you imagine, brainstorm, and visualize in your mind a future scenario. A few examples:
Some other questions that may be useful:
These kinds of discussions and use-cases can begin to establish a vision for what could be done with a more robust analytics solution.
Establish the baseline
You’ll also want to explore your current state. Start with a general listing of what data you have, where it’s at, and how it’s used. Create multiple versions of these lists, becoming more specific with each version. Continue to gain detail until the granularity isn’t worth the effort. The point is to gather a variety of information about information. Who uses what data? How do they access it or move it from one place to another? How do they analyze it? What decisions do they make with it?
This information about your information can also prove useful in that brainstorming and discussion step, above. If you have better information about the current state of your data, you can re-think what you might want to accomplish. In fact, brainstorm and discuss, and evaluate your current state—and repeat those steps until it stops being useful.
Mind the gap
Once you’ve reached a point of having a good idea for what you want to accomplish first, evaluate what it will take to get it done. Consider the questions below. Your answers to the questions will help you understand what you need to do.
At that point, you should have a sound understanding for what strategy will work at your credit union. From there, it’s up to your normal governance practices to set goals, do work, hold people accountable, and progress.
In summary
So, what started as a brief attempt at talking about data strategy has ballooned into a 5600-word thesis. We covered a ton of stuff about what you can do with data, strategies for getting to the point of doing those cool things, and a strategy for developing the strategy.
I’m convinced that every credit union can make better decisions with the data they currently have. And there’s a really good chance you can even do it with the tools you already have in place. The point is to get started. Talk with others at your institution. Inventory your data and skills and what you want to improve on. You’d be surprised what you can accomplish with the resources you have.
And at any step of the way, give me a call. I want to help.